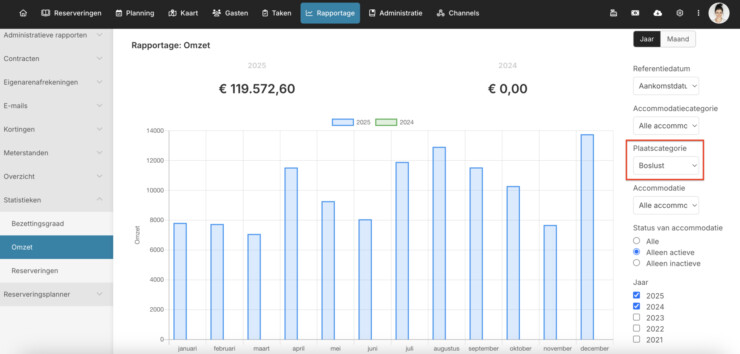
Charts for sales and occupancy can now be filtered by place category Update Reservation software 19 August 2024
Via reports > statistics, you can view different graphs for sales, occupancy and reservations per year, per month and per day. You can now filter the graphs by location category, so that you only see the statistics for a specific location. This can be a specific city, but also, for example, a country, village, street, camping field, region, etc. You can define the place categories yourself via settings > accommodation settings > places.
Read more about our reservation system!
